Essential Insights. Delivered daily, weekly, monthly.
Automated reports to your inbox. Key metrics including availability, utilization, turnover and more, generated regularly and shaped by operational best practices.
Demo Reports
Explore our interactive BI demo reports. Fully live and viewable in your browser. Dive in and see the insights for yourself.
FAQ
The Essential Insights Package includes scheduled reporting and secure data handling:
Daily Report – Delivered every morning to support day-to-day operational monitoring
Weekly Report – Sent every Monday with aggregated insights from the past week
Monthly Report – Delivered on the first day of each month, summarizing long-term trends
Email delivery – Reports can be automatically sent to up to 10 recipients
Data extraction and storage – Structured data retention to support historical analysis
The Daily Report highlights specific operational patterns to support daily fleet monitoring. It includes:
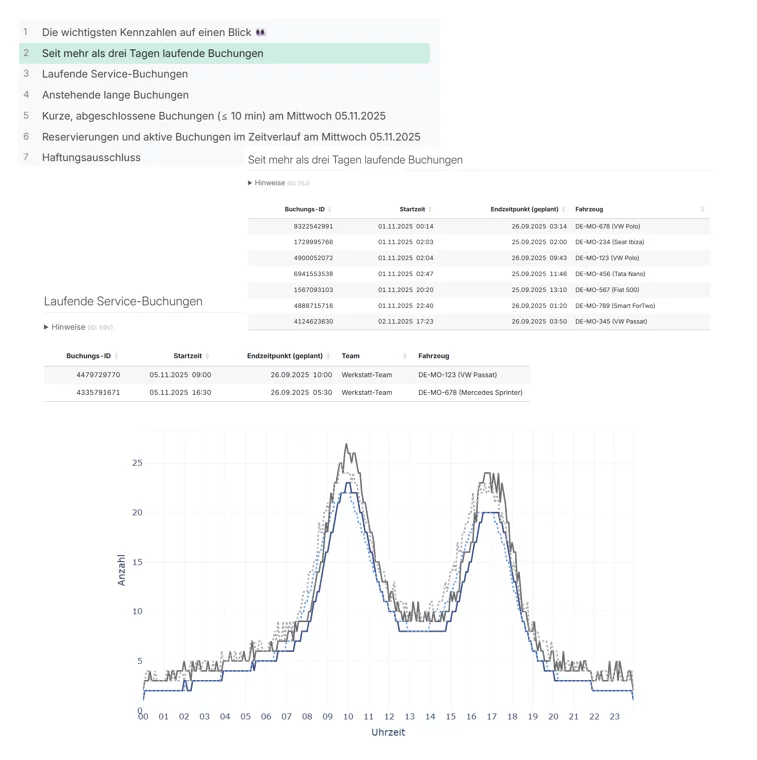
Ongoing bookings that have lasted more than 3 days
Ongoing bookings by service teams that have lasted more than 1 day
Bookings from the previous day that lasted less than 10 minutes
Utilization rate (reservations and activity) of the previous day compared to the weekday average during the four previous weeks
Upcoming bookings (within the next 2 days) with a planned duration of more than 2 days
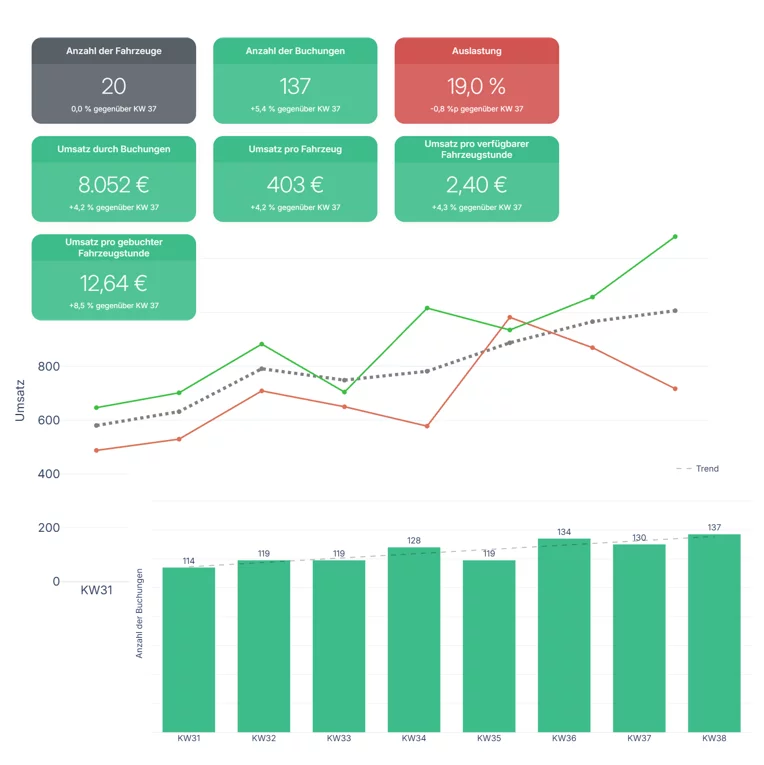
The Weekly Report provides a structured overview of the past week’s performance, framed in the context of the last 8 weeks. It includes:
Weekly revenue over the past 8 weeks — total, per vehicle, per station, by team, by pricing component, and per booked vehicle hour
Refunds per week
Number of completed bookings over the past 8 weeks
Weekly vehicle utilization rates over the past 8 weeks (booked vs. available hours)
Station-level utilization for the past two weeks (booked vs. available vehicle hours per station)
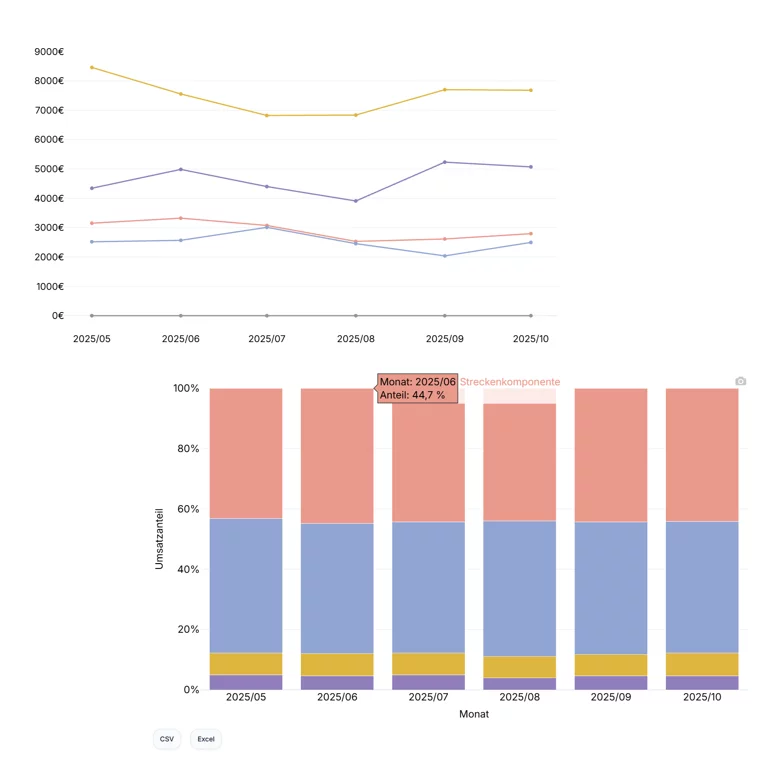
The Monthly Report offers a high-level summary of long-term operational performance, based on data from the past 6 months. It includes:
Monthly revenue for the past 6 months — total, per vehicle, per station, by team, by pricing component, and per booked vehicle hour
Number of completed bookings over the past 6 months
Monthly vehicle utilization rates for the past 6 months (booked vs. available hours)
Monthly vehicle utilization rates per station for the past 2 months (booked vs. available hours)
New registrations over the past 6 months
Active users over the past 6 months
Yes — your feedback is important to us. We actively maintain feedback loops with all customers to continuously improve our reports. We're always eager to hear your thoughts on the structure, content, and clarity of the visualizations.
That said, the reports are not fully customizable. To keep the Essential Insights Package affordable and scalable, we rely on a high degree of standardization. This allows us to deliver consistent, high-quality reporting while still evolving the product based on real-world usage and operator input.
You can view the reports on your Android or iOS smartphone, as well as on tablets and desktop devices. While the reports are mobile-accessible, they are optimized for larger screens — such as on a PC or Mac — for the best viewing experience.
Yes. Currently, our reports are available in German, English, and Italian. We’re continuously expanding our language offering based on user demand.
Trace Mobility complies with strict European data protection standards, including full EU-GDPR compliance. All data is stored exclusively in Europe.
Before we access any data, you securely provide API credentials through our portal. These credentials are stored in dedicated Key Vaults, and the connection is established via our API connector. During setup, you accept our Data Processing Agreement (DPA), which legally defines how we may process your data.
We only process data required for analytics, and access is restricted to essential personnel. We never sell or share information with third parties.
Trace Mobility is trusted by operators of all sizes, including large international companies.
Start your 30-day free trial
Get full access to the Essential Insights Package and see how Trace Mobility transforms data into insights. Completely free for 30 days.
Sign upYour journey as a new customer
From registration to tailored reporting: Follow four quick steps to unlock data-driven insights for your organization.
Create your account with company name and email, and accept the terms and data agreement.
Link your system using your API key. Enable secure data integration.
Explore automated KPI reports with your real data — free for 30 days.
Select the reporting features that fit your needs. Enjoy full flexibility with monthly billing per module.


